

Everyone is making more ads. Almost nobody is making better creatives. We have finally here the Appsflyer State of Creative optimisation 2026 report.
TL;DR (the 5-minute version) of Appsflyer’s State of Creative Optimization 2026 report
1. The volume race is real, but only the whales are running it. Gaming apps spending $7M+ per quarter went from about 2,700 to 3,977 average creative variations per app in a year (+45%). Every gaming tier below $1M stayed flat or went down. AI didn’t close the gap between big and small advertisers. It made it wider.
2. “Variation” doesn’t mean “idea.” AppsFlyer counts every localization, color swap, word change, or logo toggle as a new creative. So 3,977 variations could be 150 concepts times languages times end cards. Most of that 45% jump is probably AI doing resizing, localization, and copy swaps, not new thinking.
3. Winners are getting rarer, not easier to find. In gaming video, the top 2% of creatives now take 60.7% of spend, up from 53.5%. The top 10% take roughly 85%. More production and more concentration together mean each extra variation is worth less than last year. The tail is getting longer and dying faster.
4. Video and statics are separate crafts. In almost every vertical the attribute that wins on video loses on image. Social proof wins Puzzle video (56 to 69% of spend) and nearly disappears on DSP statics (3.2%). Action & Strategy video goes Gameplay, statics go Promotional. A screenshot of your winning video is not a static strategy.
5. Read it with a vendor filter. “Share of spend” measures what the algorithm funded, not what made money. There’s no IPM, ROAS or retention in this report. It also comes from a company that sells its own creative analysis. I talked about the accuracy here:
The one-liner for tomorrow: stop asking “how do we make more?” and start asking “how do we find the 2% faster and cheaper, and what’s our separate plan for statics?”

The numbers game got bigger, and it’s rigged toward the rich
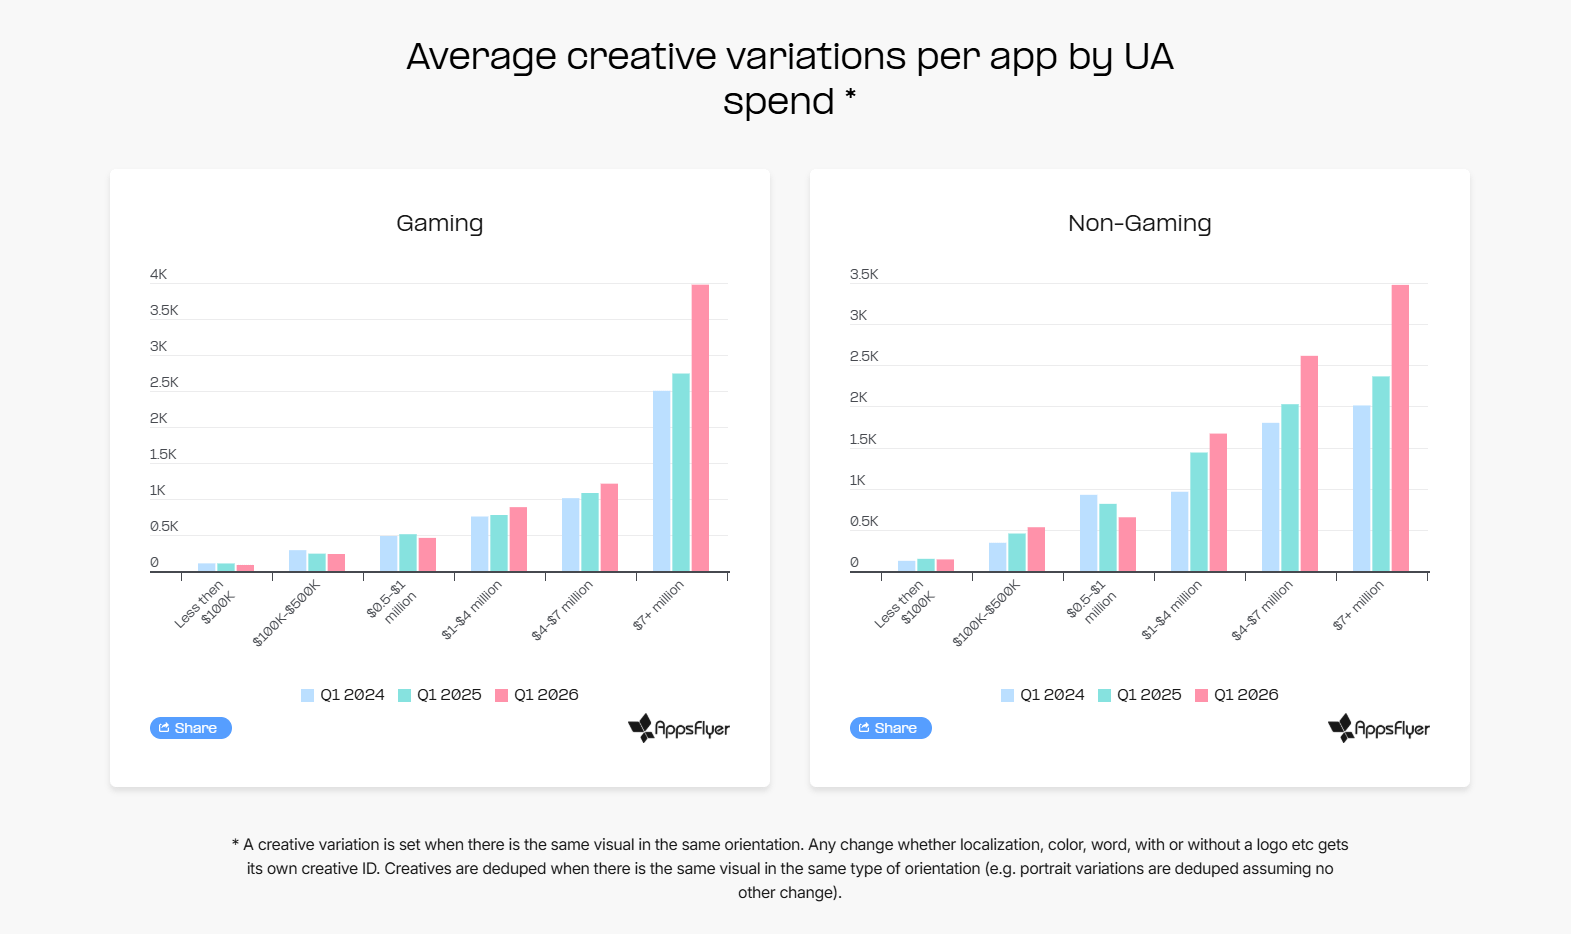
Last year the story was simple: whoever tests the most variations finds the most winners. This year AppsFlyer says the game accelerated, and the chart backs it up. Gaming apps in the $7M+ tier averaged about 2,500 variations in Q1 2024, about 2,750 in Q1 2025, and 3,977 in Q1 2026. That’s a steep curve.
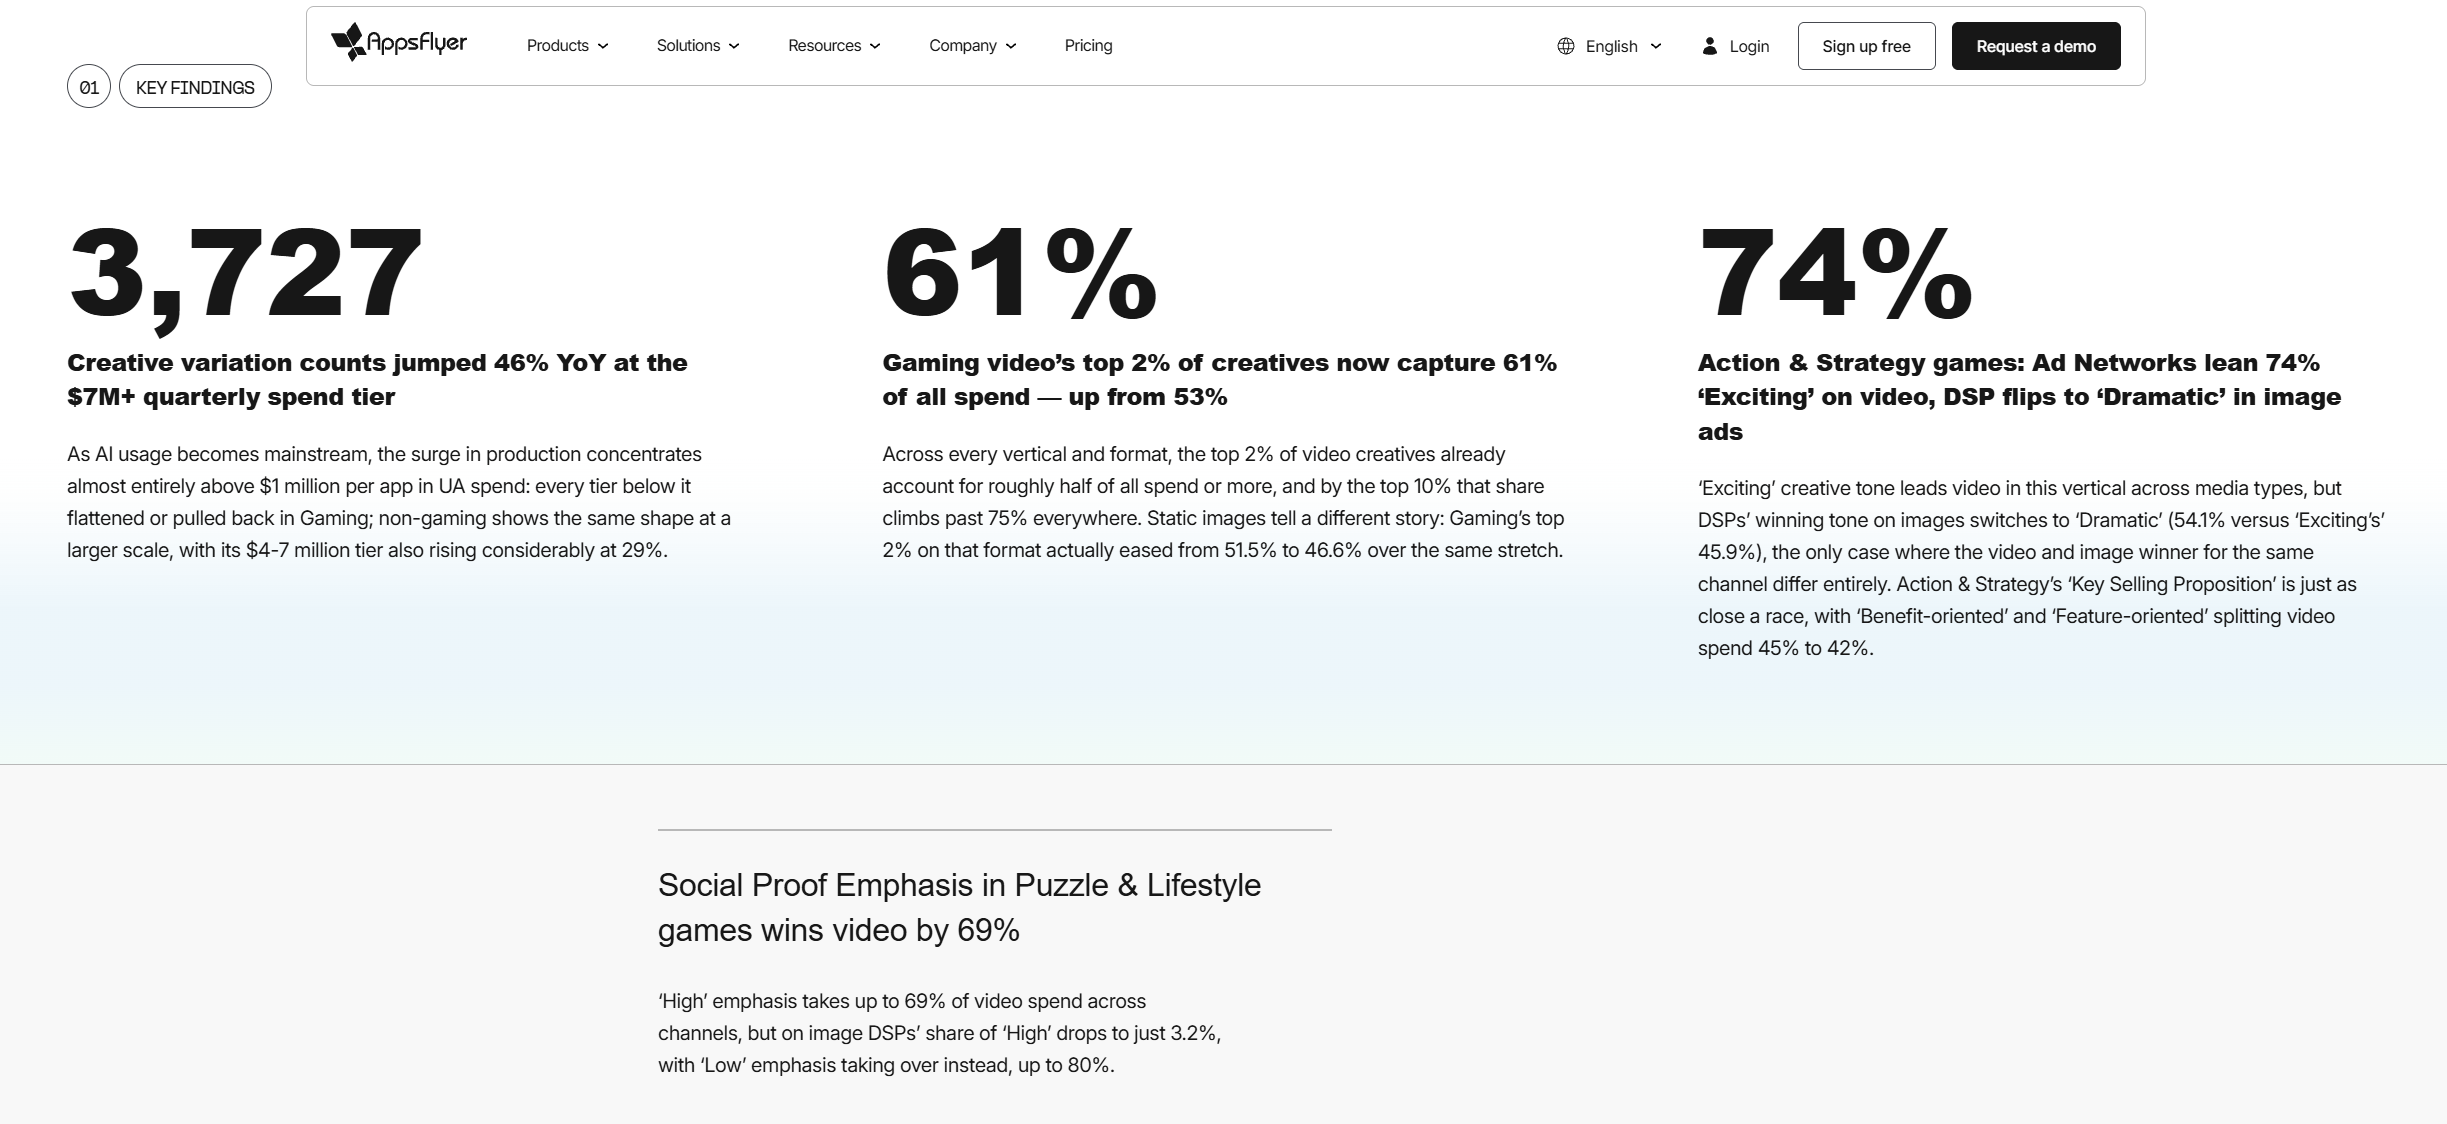
Now look at the rest of the chart. Under $100K, gaming apps went from about 100 variations to about 80. $100K to $500K went down too. $0.5 to 1M went slightly down. Non-gaming is even stranger: the $0.5 to 1M tier dropped from about 930 to about 660 over two years.
So everyone has access to the same AI tools, and the smaller advertisers produced less. AppsFlyer’s conclusion is “smaller advertisers should use AI to close the testing gap.” I think that’s the wrong reading, and here’s the napkin math.
Across tiers, the testing budget per variation stays in a similar band. The variation count follows the budget.
That means production was never the bottleneck. Testing money is. You can generate 2,000 statics tonight in any AI tool you like, but if you have $150K a quarter, 1,760 of them will get no impressions and the algorithm will never learn anything from them. Smaller advertisers didn’t fall behind because they’re lazy with AI. They figured out that volume without spend to test it is just noise with a bigger file size.
⚡️ THE AI Bible: How to Use AI in Advertising

AI is revolutionizing creative production in gaming marketing. Solo marketers and small teams can now generate high-quality game ads and creative assets faster and cheaper by leveraging AI tools for images, videos, and copy. This guide provides a practical roadmap – from writing effective AI prompts to using advanced tools like Midjourney, ChatGPT, Runway, and Google’s Veo 3 – all
The advantage the big players built isn’t the AI production pipeline. It’s the pipeline around it: automated uploads, naming conventions, auto-kill rules, tagging, and budget set aside for testing. That’s the unexciting infrastructure that turns 4,000 variations into signal instead of a messy Google Drive folder.
“Variation” is doing a lot of heavy lifting
A variation is the same visual in the same orientation, and any change (localization, color, a word, with or without a logo) gets its own ID. Portrait versions of the same visual get deduped.
So when a big publisher ships one hero video in 15 languages with 3 end-card versions, that’s 45 variations. When AI does the localization in an afternoon instead of an agency taking two weeks, the variation count jumps and nobody had a single new idea.
I’m not saying the growth is fake. I’m saying the headline 46% is not “creative teams became 46% more creative.” My honest guess is the concept count at the top tier grew much more slowly than the variation count, and AI-driven localization and micro-iteration accounts for most of the curve. If your CMO reads the report and asks why you don’t have 4,000 creatives, that’s the answer to give.
The 2% rule got tighter, and that should worry you
This is the chart I’d print and stick on the wall.
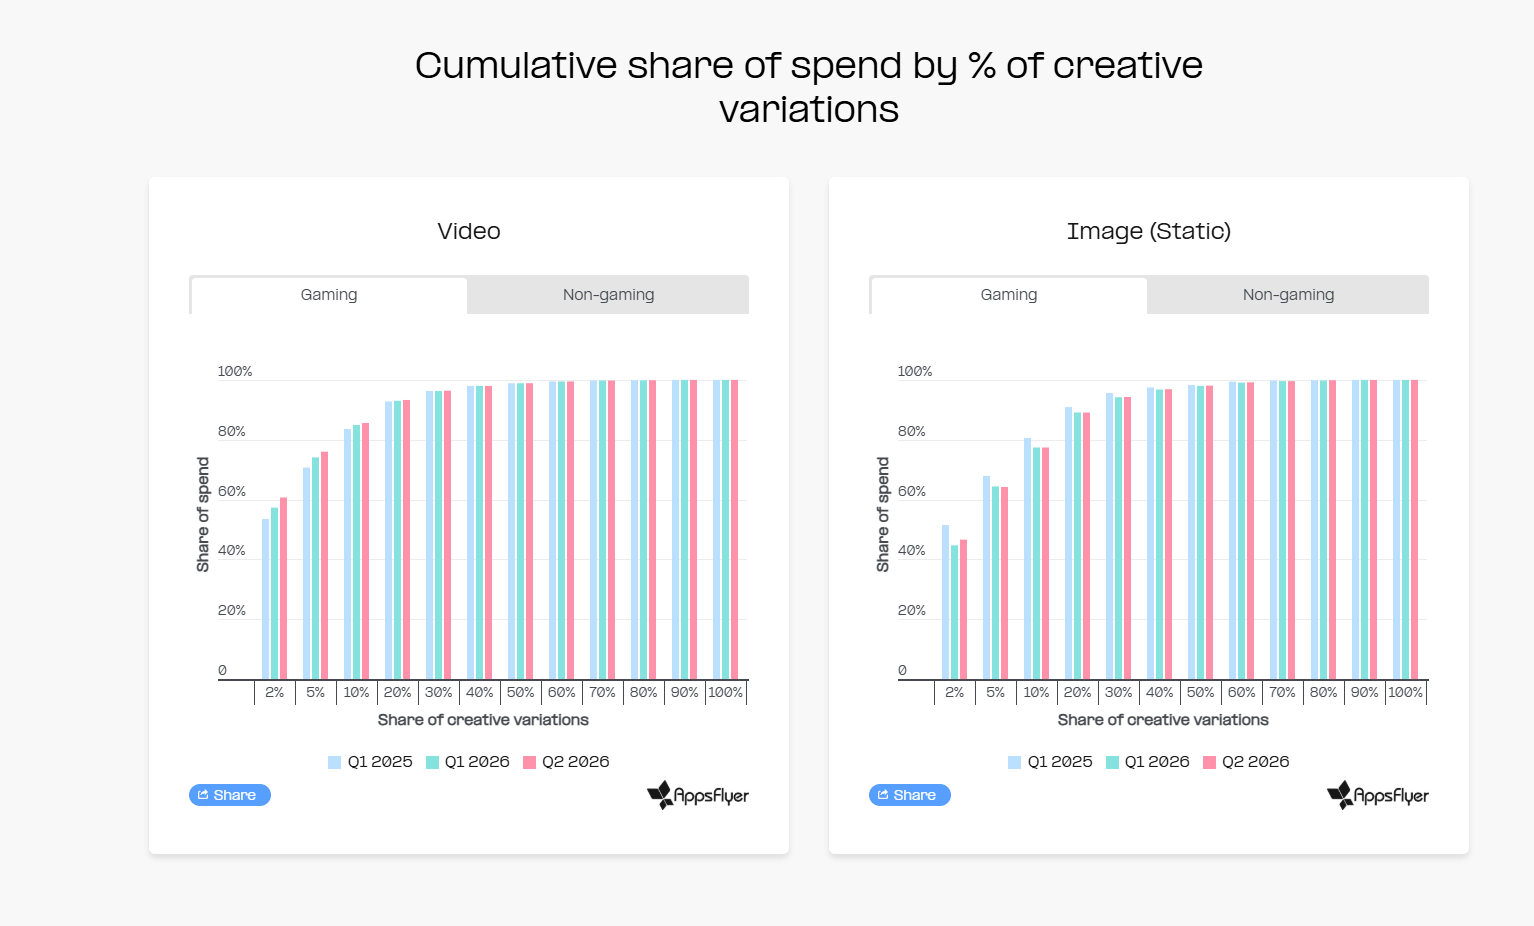
In gaming video, the top 2% of creatives took 53.5% of spend in Q1 2025 and 60.7% in Q2 2026. The top 5% went from roughly 71% to 76%. The top 10% is around 85%. Past the top 20%, you’re fighting over scraps.
Combine that with the volume chart. The biggest advertisers made about 45% more variations, and their spend was concentrated more in fewer winners. So the hit rate per variation went down. The algorithms (AppLovin especially, but also Meta’s Advantage+ and the DSPs) are getting faster and more decisive about picking a winner and putting everything behind it. Your “pretty good” creative doesn’t get a gentle 3% of budget anymore. It gets zero.
That’s bad news for anyone whose process is “produce, upload, wait two weeks, look at the dashboard.” It’s good news for teams that treat testing as an efficient process: cheap tests, quick kills, and fast iteration on anything that shows early IPM.
Statics went the other direction. Gaming image top-2% share dropped from 51.5% to 46.6%. AppsFlyer frames it as image spend “spreading more evenly.” I’d be careful here. It could mean statics are less winner-take-all. It could also mean everyone flooded networks with AI statics in the last year and the algorithm hasn’t found a clear favorite among a lot of similar content.
Video and statics are different sports
This is the most useful part of the report, and it’s the part most teams ignore in practice. Here’s what we do: we cut the winning video, take the best frame, add a logo and a CTA, and call it a static. The data says that’s backward.
Puzzle & Lifestyle. Social Proof “High” takes 56 to 69% of video spend across channels. On statics, “Low” takes over, and DSPs give “High” only 3.2%. The creative tone on video is led by Exciting (around 32 to 42%), while statics go strongly Cheerful (about 47 to 62%). Content approach on video is gameplay-led (around 45% on Social and Ad Networks). On statics, gameplay is almost absent and features, promotional and brand content take over. Gameplay shown on video: over 90%. The video sells the loop. The static sells the feeling.
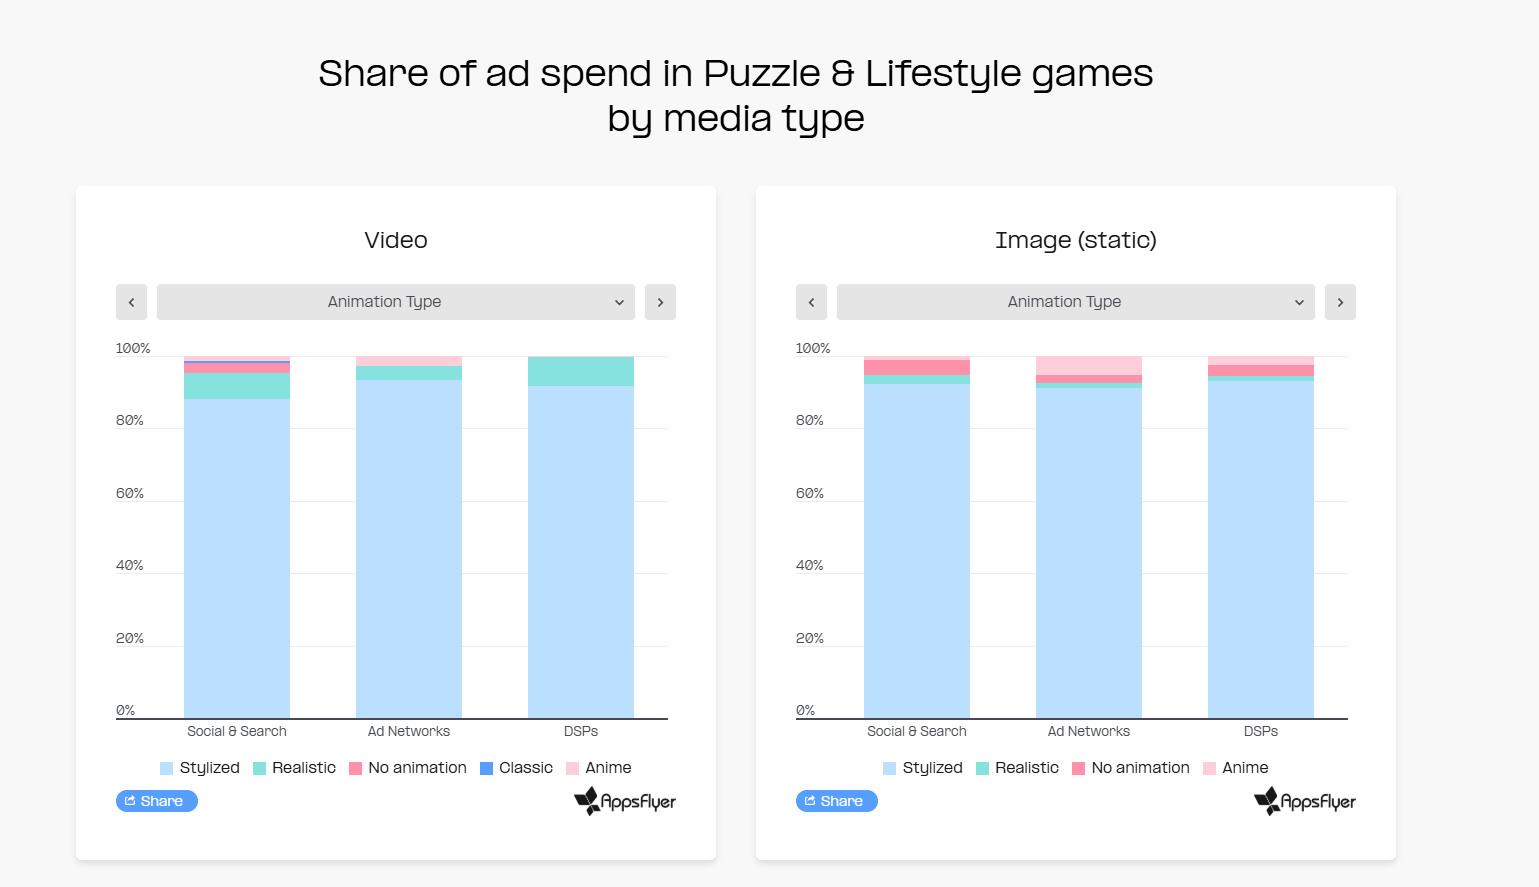
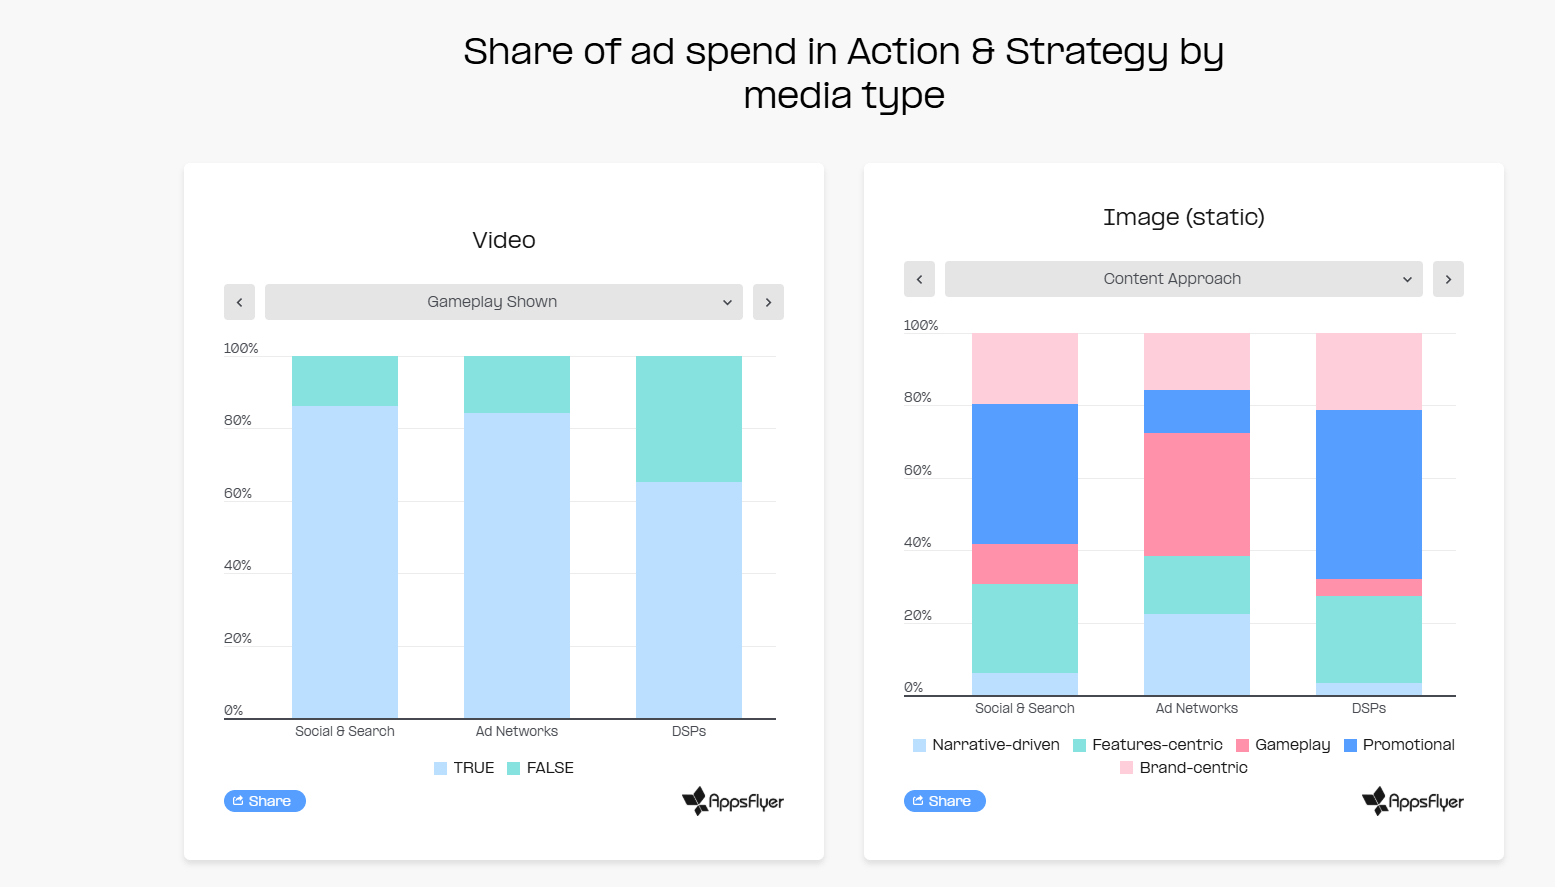
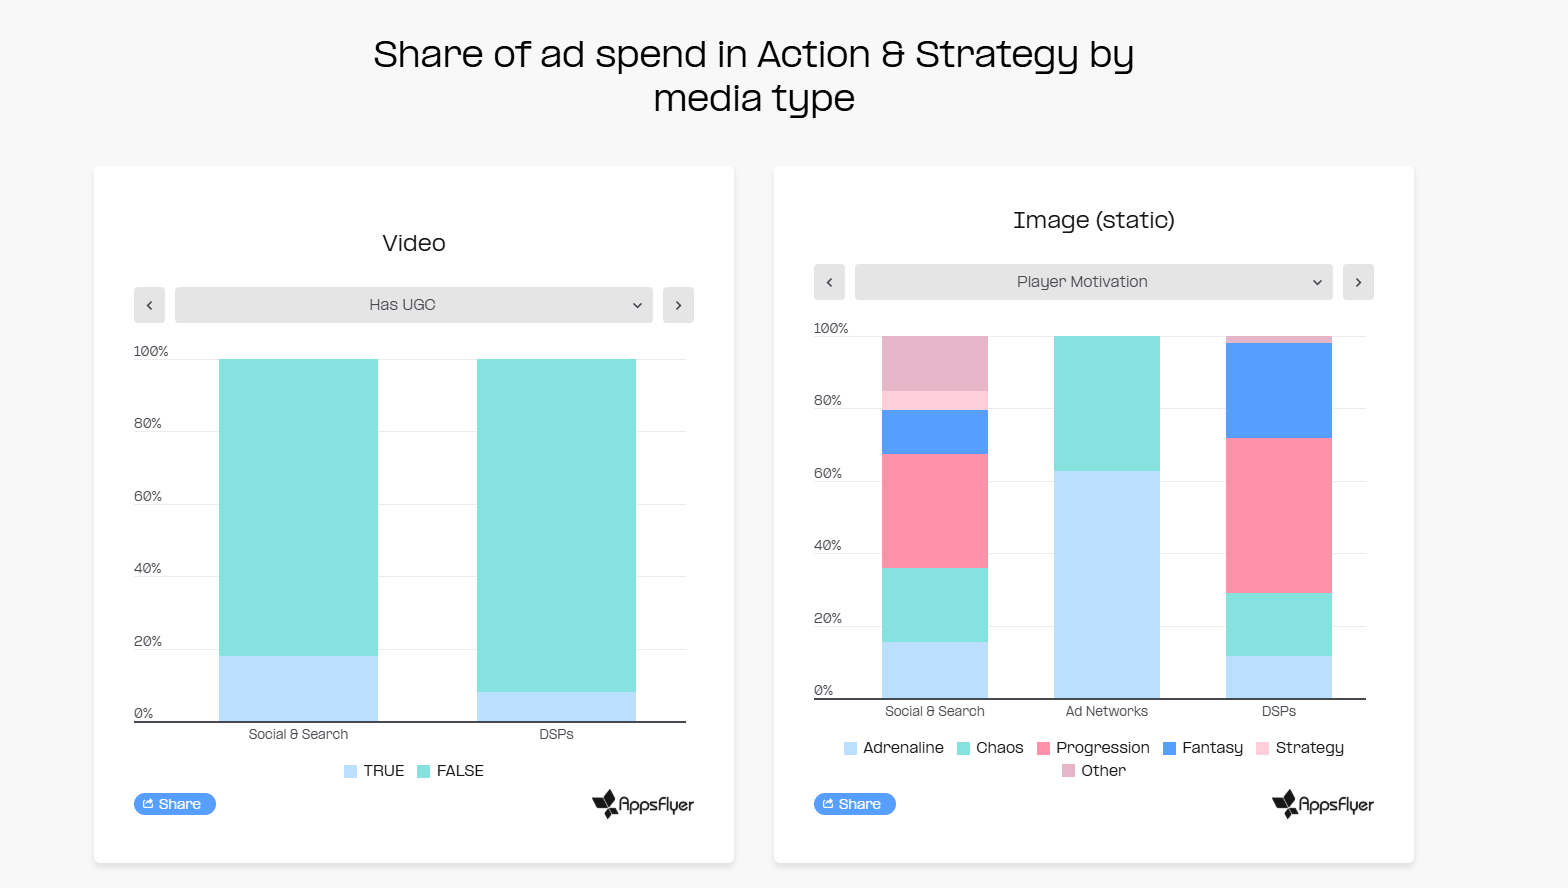
Action & Strategy. Video is gameplay-heavy (about 84 to 86% show gameplay on Social and Ad Networks, around 65% on DSPs). The static winner is Promotional (46.5% of DSP image spend). Ad Networks’ statics go all-in on Adrenaline as the player motivation (62.6%, more than twice its video share), and DSP statics flip the tone to Dramatic. Here’s a small detail I like: on Social & Search statics in Action & Strategy, high social proof takes about 70%. That’s the opposite of Puzzle. So you can’t even carry the rule “social proof doesn’t work on statics” across genres. The format flip is genre-specific.
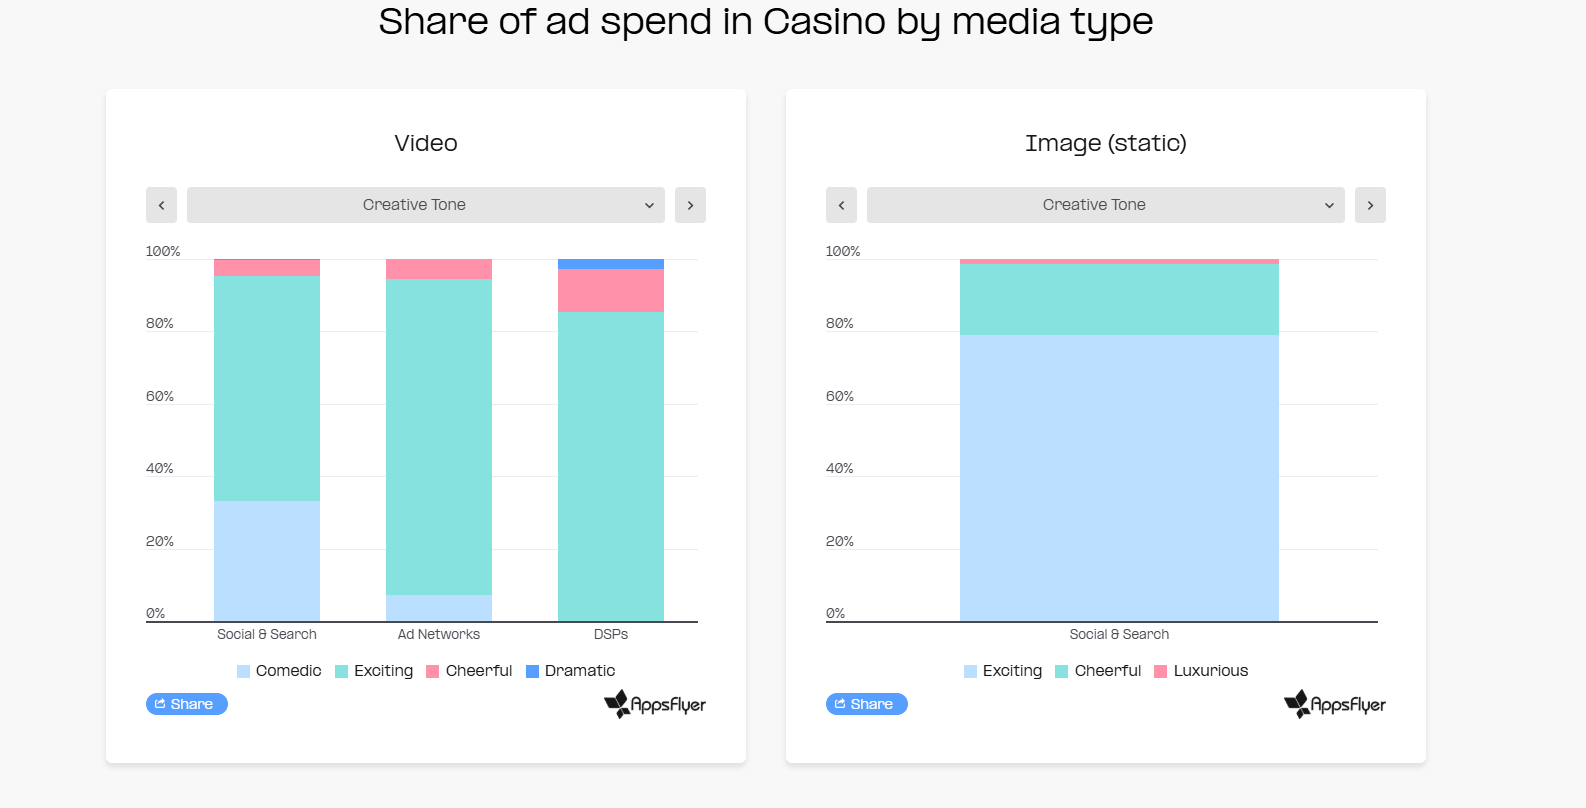
Casino. High CTA urgency leads to video at 55 to 64% and hits 87 to 93% on statics. Comedic tone gets about a third of Social video spend, and it disappears on image.
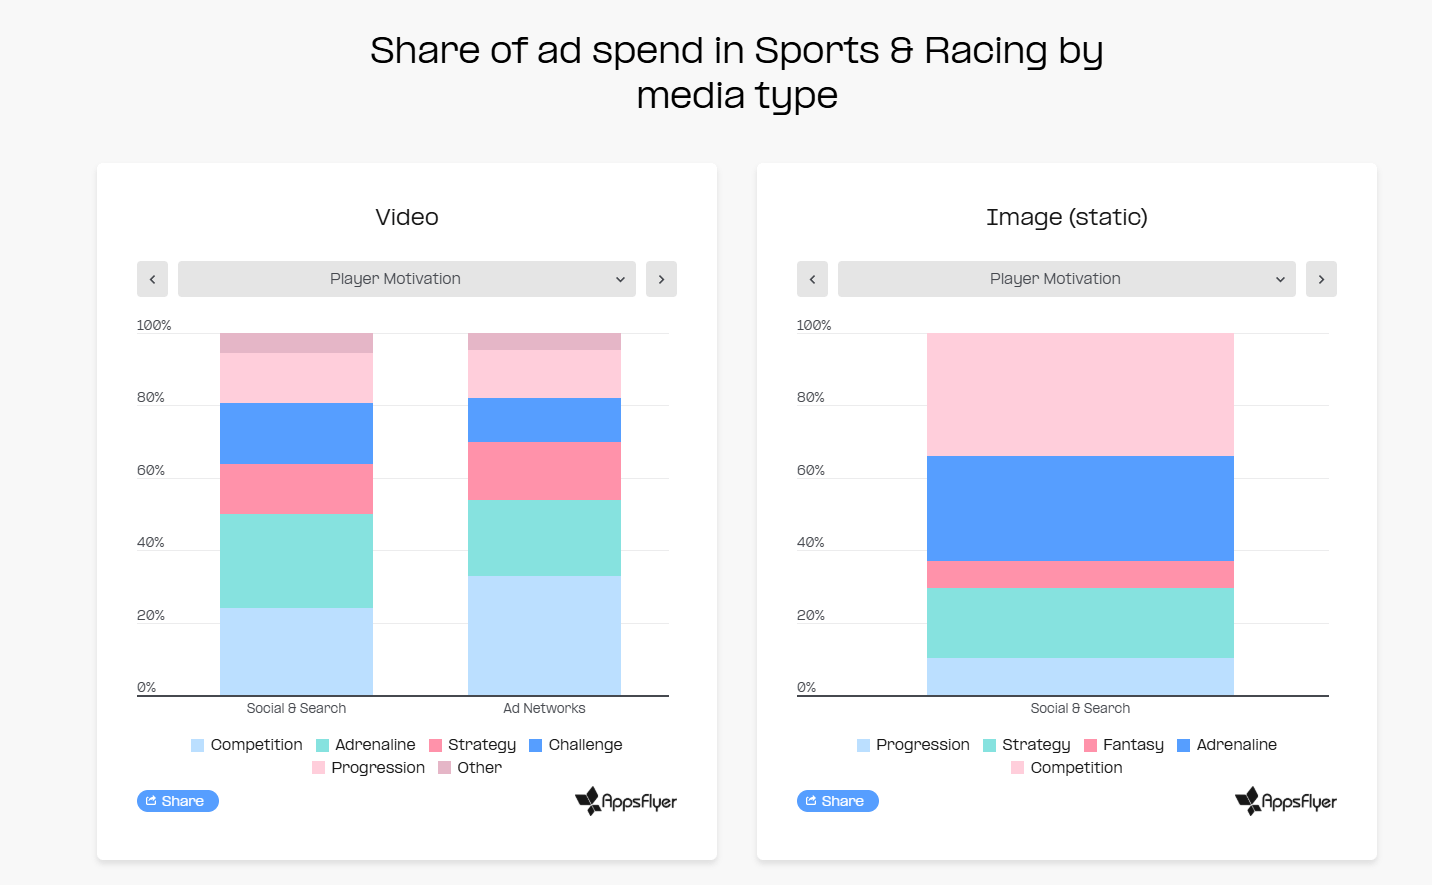
The shared pattern is easy to understand. Video has time: it can tell a story, show a testimonial, build anticipation, make you laugh. A static gets one glance. One emotion, one offer, one clear ask. Anything that needs time to land (social proof, progression, humor, a feature walkthrough) moves out. Anything that works in a split second (urgency, adrenaline, a promo, a price) moves in.
So statics need their own brief, their own concepts, and their own iteration loop. If one person makes them on a Friday afternoon out of video leftovers, you’re leaving money on the table on every channel that still buys images.
The boring truth about what wins in video
If you strip out the differences between verticals, the winning gaming video in 2026 looks pretty unglamorous. It’s animated (about 70 to 90% of spend in Puzzle and Action & Strategy). It shows gameplay (85 to 95%). It isn’t UGC (UGC is roughly 8 to 20% of spend in the gaming verticals). It uses an Exciting or Thrill tone. Action & Strategy video puts 43 to 45% of spend on Thrill as the emotional hook, with Anticipation second.
UGC is the most interesting line. Everyone on LinkedIn has been selling UGC as the savior of game creative for two years. In the gaming data here, it’s a minority share. In Media & Entertainment, it takes 90.8% of video spend. That’s a completely different category. UGC isn’t dead. It’s a tool with a specific job, and in games that job usually isn’t carrying the scale campaign on its own. My read: UGC is an experimental layer and a Meta/TikTok tactic, not your main production line.
Hook type is where there’s real tactical gold. In Puzzle, Social & Search lean on the gameplay hook, while Ad Networks and DSPs lean on the Problem hook (29% and 27.9%). The algorithmic channels reward “here’s the pain” before “here’s the loop.” For anyone making AppLovin video: test problem-first openings against gameplay-first. It’s a cheap test with a clear hypothesis.
What this means for production
If I had to condense this report into how a creative team should work in Q4, it’s three things.
Build for speed of learning, not volume of output. The number that matters isn’t how many variations you ship. It’s how many days it takes to go from a new concept to a confident kill or scale decision.
Split concept work from variation work. Humans do concepts. AI and automation do variations (localization, end cards, CTA swaps, aspect ratios, color tests). Stop making your best designers resize. Full STOP!
Give statics a real seat at the table. Their own brief, their own concepts based on the one-glance logic, their own testing budget.
But based on your UA channel mix, you also should definitely focus on playables.
📖The Playable BIBLE: Winning recipe for 2026

Playable ads in 2025 stopped being a “cool side format” and quietly became the backbone of serious UA, especially once you plug them into video‑led funnels, AI workflows, and brutal creative volume.
What to bring to tomorrow’s brainstorm
These are “prompts” for the room, not answers. Hope you see what I did there…
1. What’s our real concept count? Take last quarter’s creatives and count distinct concepts versus variations. If the ratio is 1:30, we don’t have a volume problem. We have an idea problem. (I totally made up the 1:30 ratio) This all depends on the lifecycle of your game, obviously, but make sure you are focusing on bringing new concepts to the creative table
2. What’s our cost per test and days to verdict? How much do we spend before we kill a creative, and how long does it take? If it’s more than a week on AppLovin, that’s the first thing to fix.
3. Statics, from scratch. Pick one game. Brief five static concepts that couldn’t exist as a video: one-glance, one emotion, one funny situation. No screenshots allowed.
4. Problem-hook sprint. Take our best-performing gameplay video, keep the body, and rebuild the first three seconds into three problem-first openings. Test on the algorithmic networks.
5. Social proof by format. Where do we use it on video? Where do we accidentally carry it into statics where it probably doesn’t work? (And for anything Action & Strategy on Social, test it on statics, because the data says it flips there.)
6. Automation over generation. What in our pipeline is still manual (naming, uploading, tagging, kill rules)? Every hour saved there is worth more than another AI video tool.
7. What would we do with double the budget? If the answer is “make twice as many creatives,” we’re thinking about it wrong. If the answer is “test twice as fast,” we’re close.
"Share of spend measures what the algorithm funded, not what made money" should be printed on every creative report.